Full text loading...
Oxygen loss in the ocean, termed deoxygenation, is a major consequence of climate change and is exacerbated by other aspects of global change. An average global loss of 2% or more has been recorded in the open ocean over the past 50–100 years, but with greater oxygen declines in intermediate waters (100–600 m) of the North Pacific, the East Pacific, tropical waters, and the Southern Ocean. Although ocean warming contributions to oxygen declines through a reduction in oxygen solubility and stratification effects on ventilation are reasonably well understood, it has been a major challenge to identify drivers and modifying factors that explain different regional patterns, especially in the tropical oceans. Changes in respiration, circulation (including upwelling), nutrient inputs, and possibly methane release contribute to oxygen loss, often indirectly through stimulation of biological production and biological consumption. Microbes mediate many feedbacks in oxygen minimum zones that can either exacerbate or ameliorate deoxygenation via interacting nitrogen, sulfur, and carbon cycles. The paleo-record reflects drivers of and feedbacks to deoxygenation that have played out through the Phanerozoic on centennial, millennial, and hundred-million-year timescales. Natural oxygen variability has made it difficult to detect the emergence of a climate-forced signal of oxygen loss, but new modeling efforts now project emergence to occur in many areas in 15–25 years. Continued global deoxygenation is projected for the next 100 or more years under most emissions scenarios, but with regional heterogeneity. Notably, even small changes in oxygenation can have significant biological effects. New efforts to systematically observe oxygen changes throughout the open ocean are needed to help address gaps in understanding of ocean deoxygenation patterns and drivers.
Article metrics loading...
Full text loading...
Literature Cited
Data & Media loading...
Download all Supplemental Material as a single PDF. Includes Supplemental Table 1 and Supplemental Figures 1-3 (also reproduced below).
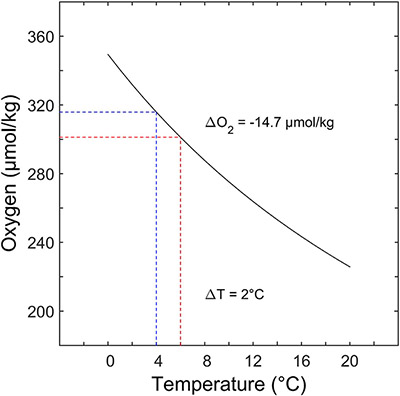
Supplemental Figure 1. Oxygen solubility as a function of temperature for seawater at constant salinity. Lines reflect change with 2°C of warming. From Brewer PG, Peltzer ET. 2016. Ocean chemistry, ocean warming, and emerging hypoxia: commentary. J. Geophys. Res. Oceans 121:3659–67. https://doi.org/10.1002/2016JC011651
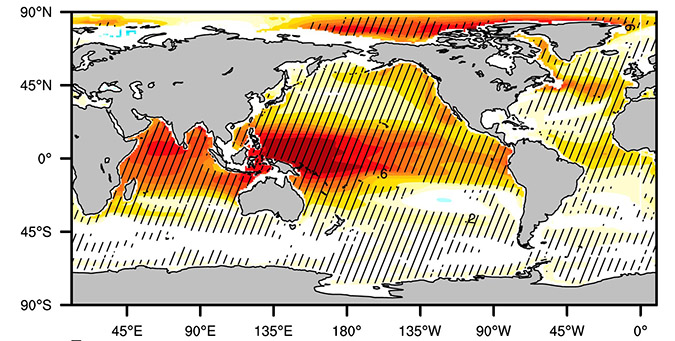
Supplemental Figure 2. Multimodel ensemble average (of ten of the CMIP3 climate models under the SRES-A2) of the difference between average stratification in 2050-2099 and 1950-1999, where stratification is defined as the density difference between 200 m and the surface. Colors scale from -1 to + 1 where declines in stratification are in blues (<0) and increase in stratification is in warm colors (> 0). Hatching identifies areas where at least 90% of the models agree on the sign of the change. White areas correspond to regions where changes are below the contour interval in absolute value or less than 60% of the models agree on the sign of the change. From Capotondi A, Alexander MA, Bond AN, Curchitser EN, Scott JD. 2012. Enhanced upper ocean stratification with climate change in the CMIP3 models. J. Geophys. Res. 117:C04031. https://doi.org/10.1029/2011JC007409
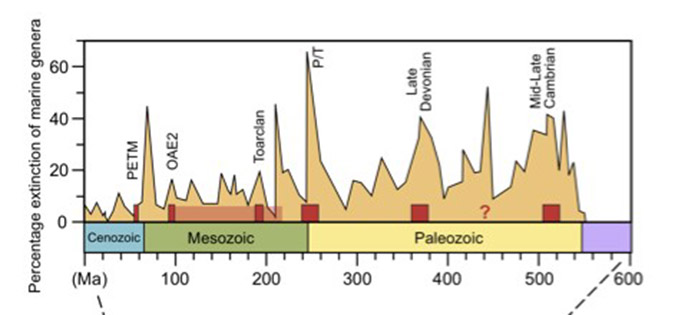
Supplemental Figure 3. Episodes of widespread oxygen deficiency in the Phanerozoic deep ocean (red boxes) superimposed on percent extinction of marine genera. An extended period of widespread ocean anoxic events occurred during the Mesozoic greenhouse climate period. Figure courtesy of Ariel Anbar and Timothy Lyons.